Before the internship began, my brain had already started awaiting it. The internship is just 4 months away. Okay, it’s 2 months to go now. A month! And then it began… and ended! Just like that. 4 months were over. I had interned at Kayako for 2 and a half months the entire summer.
Phew, time flies! Scary. Yet I’m happy. My SRE internship at Kayako in Gurgaon has gone from an impossibility to a possibility; to an actuality and now a memory. I’ve had enough experiences over the last 2 and half months to fill a lifetime and I’ll try to recollect a few of those in the next few paragraphs.
The Hiring
Let’s begin at the beginning. How did I end up at Kayako? My friend Dhruv who was working with Kayako referred me to the opportunity. I started with a small puzzle, which was then transformed into a simple web app creation. After that, I had two interviews, one with Ruhi (HR) and one technical with Kashif (Director of Engineer) over the phone.
I ultimately received and accepted my offer. I was always interested in SRE/DevOps stuff and yet I had only a little experience of how things work in production. So I was very relieved that I had found an internship of my interest.
Weeks 1-2: Arriving at Kayako
Upon arrival, I received the latest and most powerful MacBook Pro, a Thunderbolt monitor, Wireless Keyboard and Wireless Mouse. I was shown my desk and introduced to my mentor, Gufran. On the same day, I had one meeting with Gufran who was working as an SRE and another with Ankit who was a senior product engineer. Gufran told me about various microservices they built, open source projects they were using, distributed system architecture and introduced to my project. Ankit told me about the product, K5 (Kayako 5).
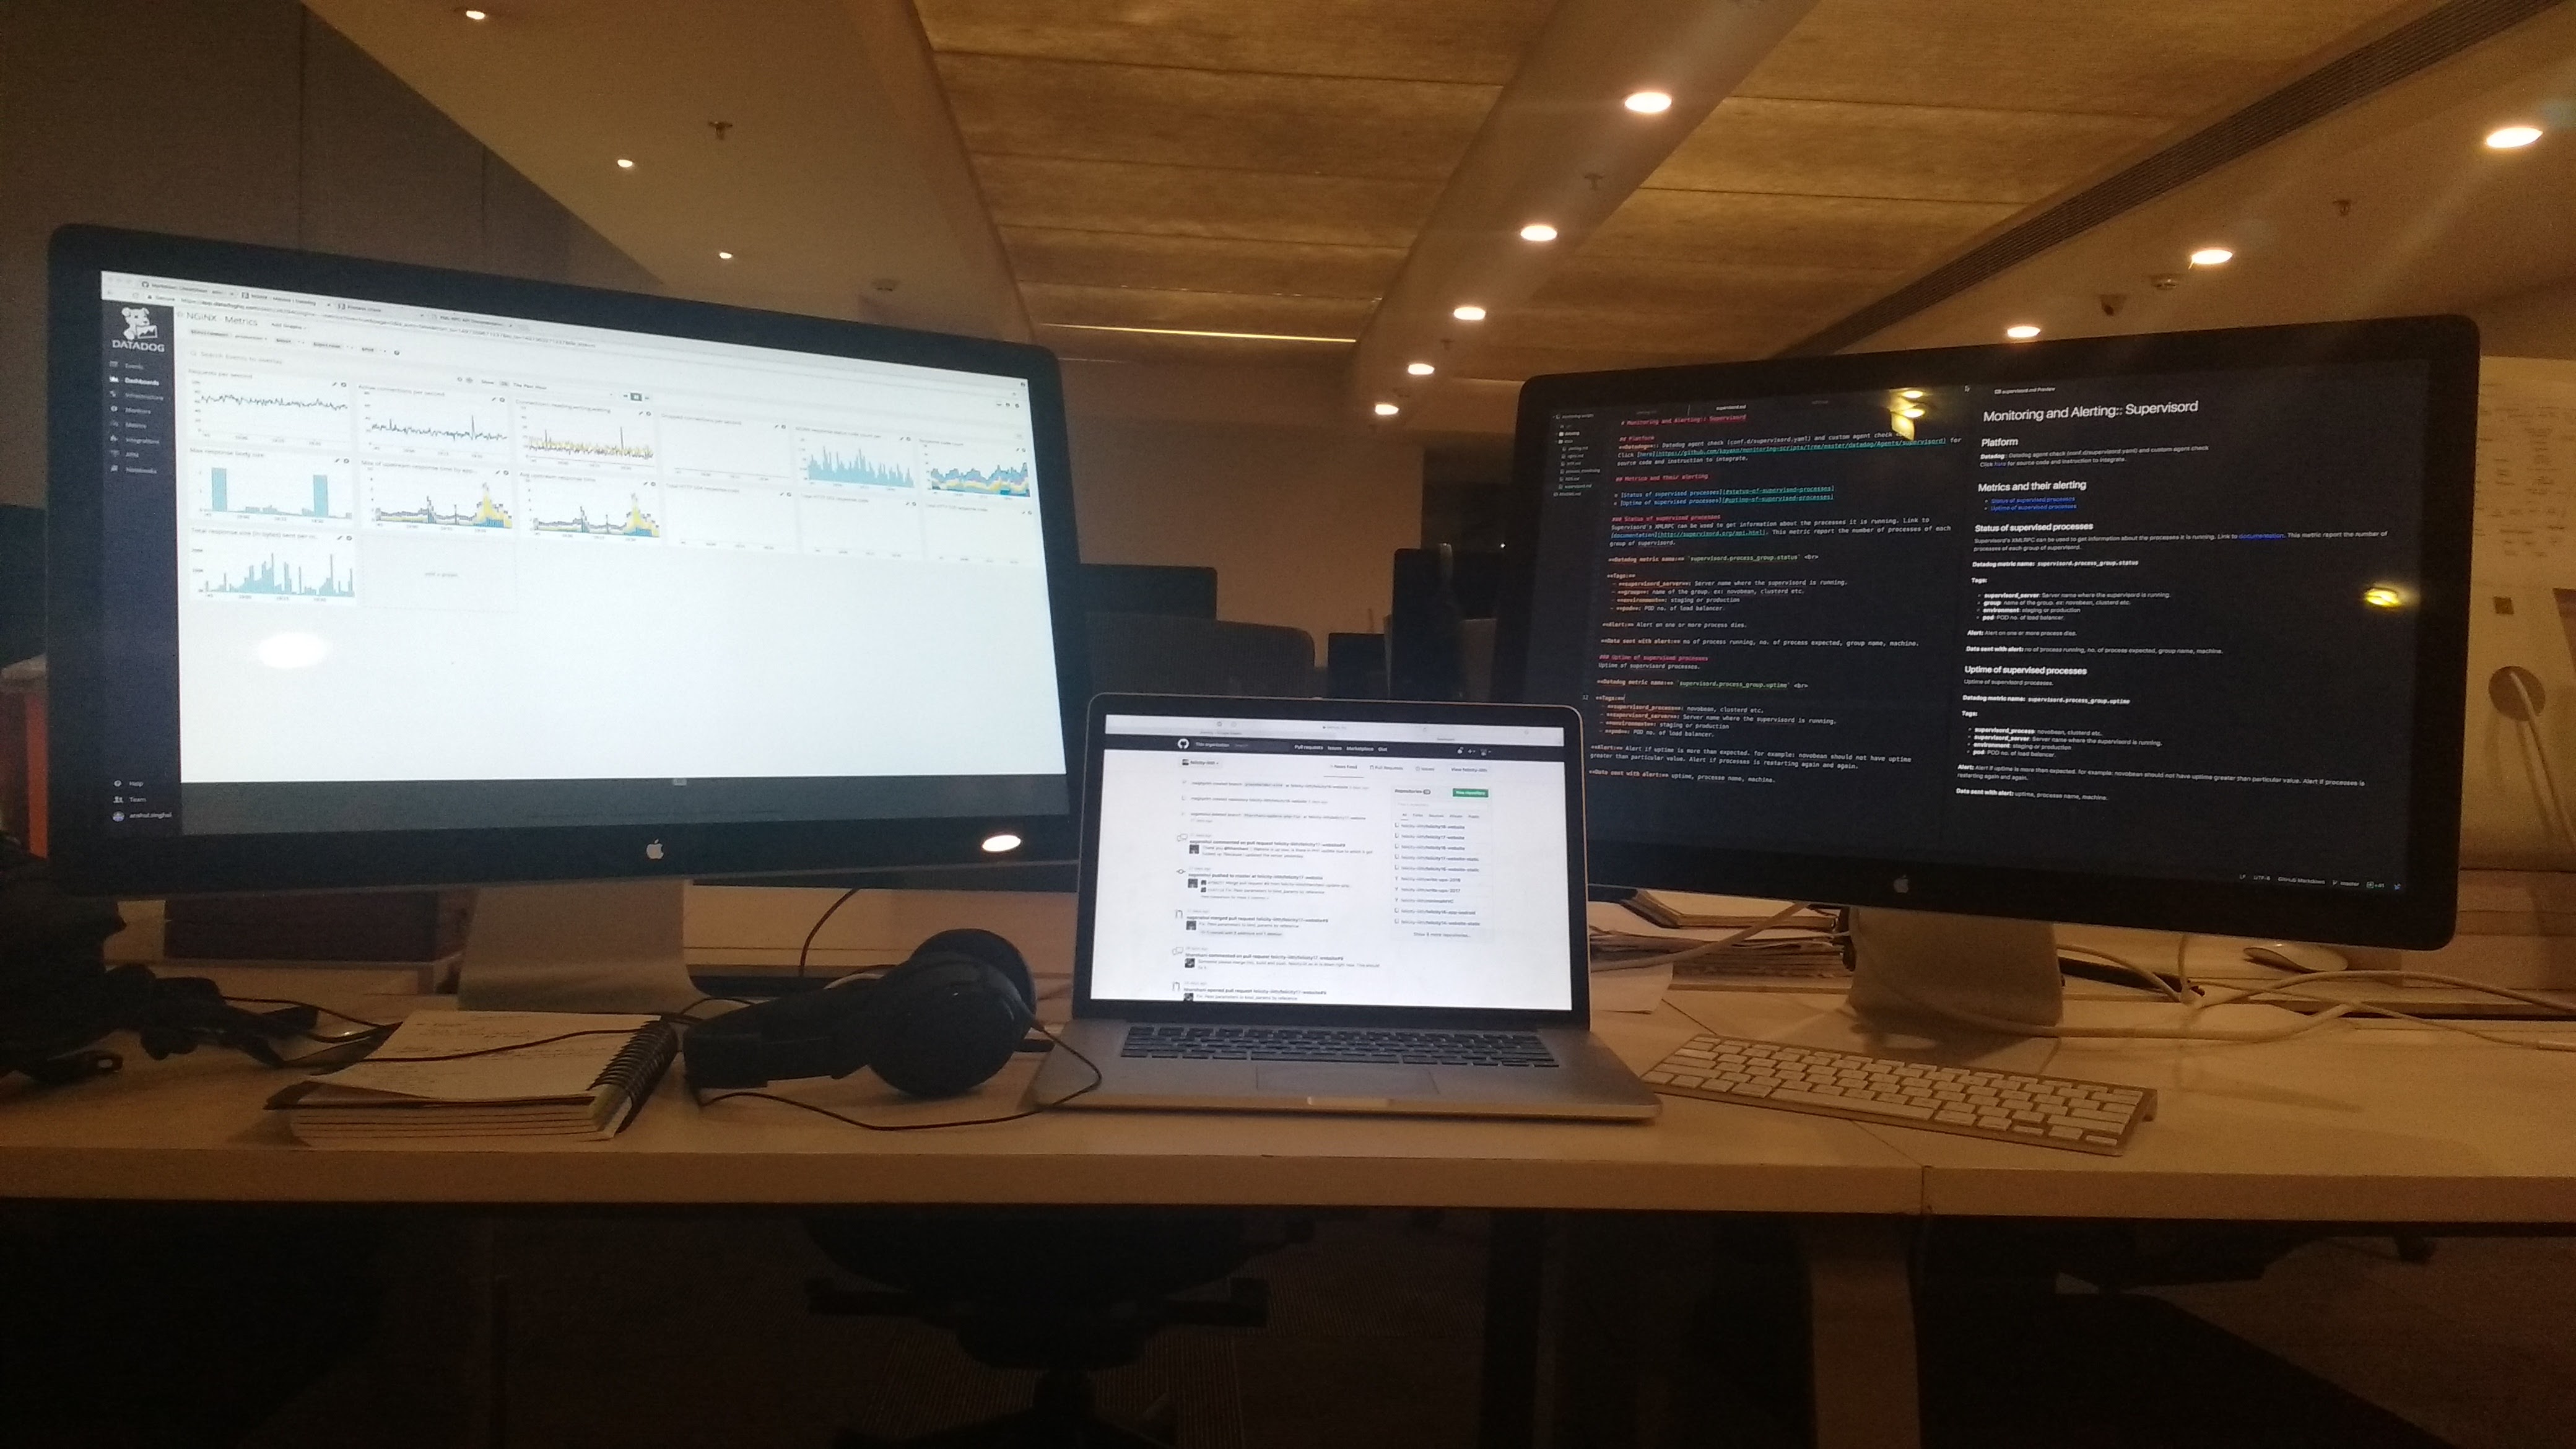 My Kayako Setup
The Project
As our infrastructure was growing, there was a need for monitoring and alerting of each and every component in our infrastructure. My project was to implement the same using Datadog which is real-time monitoring platform. The project also included writing Chef Recipes to manage these configs/scripts.
Monitoring is actually a typical task because of following reasons:
- First you need to have knowledge of each and every component like what it does, how it works, how it is deployed etc.
- After understanding components, you need to think what actually needs to be monitored and then learn how to monitor it.
- After banging your head with all other stuff, the main task becomes to think when the matrices need to be alerted. For example,
Request per secondgives alert either value bumps suddenly or value comes down to zero.
The first two weeks of my internship were mostly filled with learning, learning, and learning. I read about Datadog, learned how to write Chef recipe, asked questions about different components in the infrastructure. By the end of two weeks, I had a fair knowledge of existing infrastructure, Datadog and Chef to get my project started.
I should say week 1-2 had my head in a whirlwind. A lot of things were pretty new for me. Though I was a little bit scared, I was happy that I would in the worst case, learn a LOT for sure.
Weeks 3-6: Settling In
The first component which I had to conquer was Nginx. Kayako was using nginx both as a load balancer and as an app server. Nginx was not very complicated or so I was led to believe . There are two ways to monitor nginx.
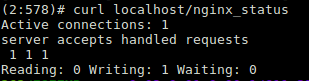
Nginx status page
Nginx status page gives real-time data about Nginx’s health, but this information was not sufficient.
An example output for status page.
Access logs for nginx
We then decided to parse the log, but to parse the log and submit the corresponding matrices in real time to DatadogHQ was arduous.
Hail Datadog! It provides a feature called Dogstreamer. It helps to graph the log data in real-time, all the time. So I wrote a parser for the same. This log parsing was providing us with a lot of useful information. We were able to graph our error rates (i.e. 500s, 502s, 503s), analyze the traffic from various desks, hit rate of our APIs and many more.
Similarly, we went through each and every component, analyze the matrices and implemented the same. Some of the important components were PHP-FPM, AWS RDS, Elastic Cache (Redis), Elastic search, Consul, Deployments, Crons etc.
By the end of this period, I completed the first phase of my project, i.e., to implement the monitoring. Now the second phase was to alert these matrices.
Weeks 7-9: Becoming Useful
The last month of my internship was most exciting maybe because I had gotten used to all the good stuff at Kayako. I was spending even more time in the office, working on the alerting, taking part in discussions, playing PS4. I began to realize the importance of what I had built so far. The monitoring was helping in identifying issues with the product. We were continuously adding new matrices, new tags for filtration and everything was good so far until we started realizing the issue with nginx log monitoring.
The Dogstreamer issue
Issue
As mentioned earlier, we were utilizing Datadog dogstreamer to monitor logs. There was an issue with metric, nginx.net.status. This metric was a counter metric. We were sending data with tag code: <status:code>. Now the issue we came to know was that we were getting the false count in Datadog dashboard.
Resolution and Hack
I spent 3 straight sleepless nights in order to debug the issue. At first, I thought that the issue was with the parser, but soon I was convinced that the parser was honest. I was scratching my head, getting frustrated. We tried all the possible hacks possible, but we found nothing.
Sometimes you get to the point of frustration, that you just become silent.
At last, I decided to read the source code for dd-agent(Datadog agent), where I found something fascinating. Before explaining the issue and solution, I would like to explain the working of dd-agent.
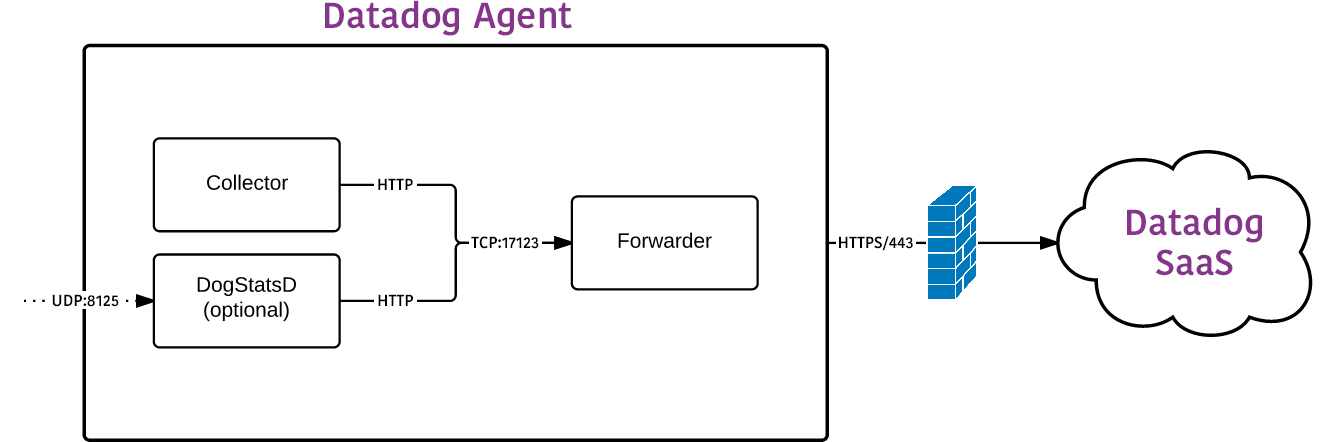 Datadog Agent Architecture
The diagram shows the black box architecture of dd-agent. In the diagram:-
- The collector is responsible for gathering system and application metrics from the machine.
- The forwarder is responsible for buffering and communicating with Datadog HQ over SSL.
- dogstatsd is responsible for aggregating local metrics sent from your code.
The issue was that for the dogstreamer if there are many values per second for a metric, Datadog takes the median without considering the tags attached. This resulted in the loss of lots of data which was not acceptable for this kind of metric where each and every line of a log was very precious and hence our dogstreamer broke.
Now to quickly fix this issue, I implemented a hack where we were using the complete pipeline of Dogstreamer, i.e., to tail and parse the logs but to submit the final data we used dogstatsd. The key feature of dogstatsd is that it submits all the data it gets. And that’s how we resolved this issue.
As a programmer, I like challenges. This bug is a challenge that I would call life’s favorite - because it involved every stage of development. I learned how to believe in my code, how to approach a problem and a lot of techniques. By the end of this period, I had completed alerting. I had also started writing documentation.
There are no words to describe the happiness and joy you feel when you finally see your code in production. Yes, everything that I built or wrote was in production. My whole team was using it. Now I was in my final stage to complete the documentation.
Weeks 10: Wrapping up
As much as I didn’t want it to happen, my last week had come. While you would imagine it as the most hectic part of my internship, it really was the most relaxed one, to be honest. Most of my work was done or going through some final (code) reviews, writing documentation so I thankfully didn’t have as much on my plate as the weeks before.
And that was it, my internship was over. I was sad about leaving my team and the Kayako life, but very happy that all the late nights and early mornings paid off in the form of seeing my work in production. On my last day, my team got me a delicious cake and gave me a very sweet farewell card.
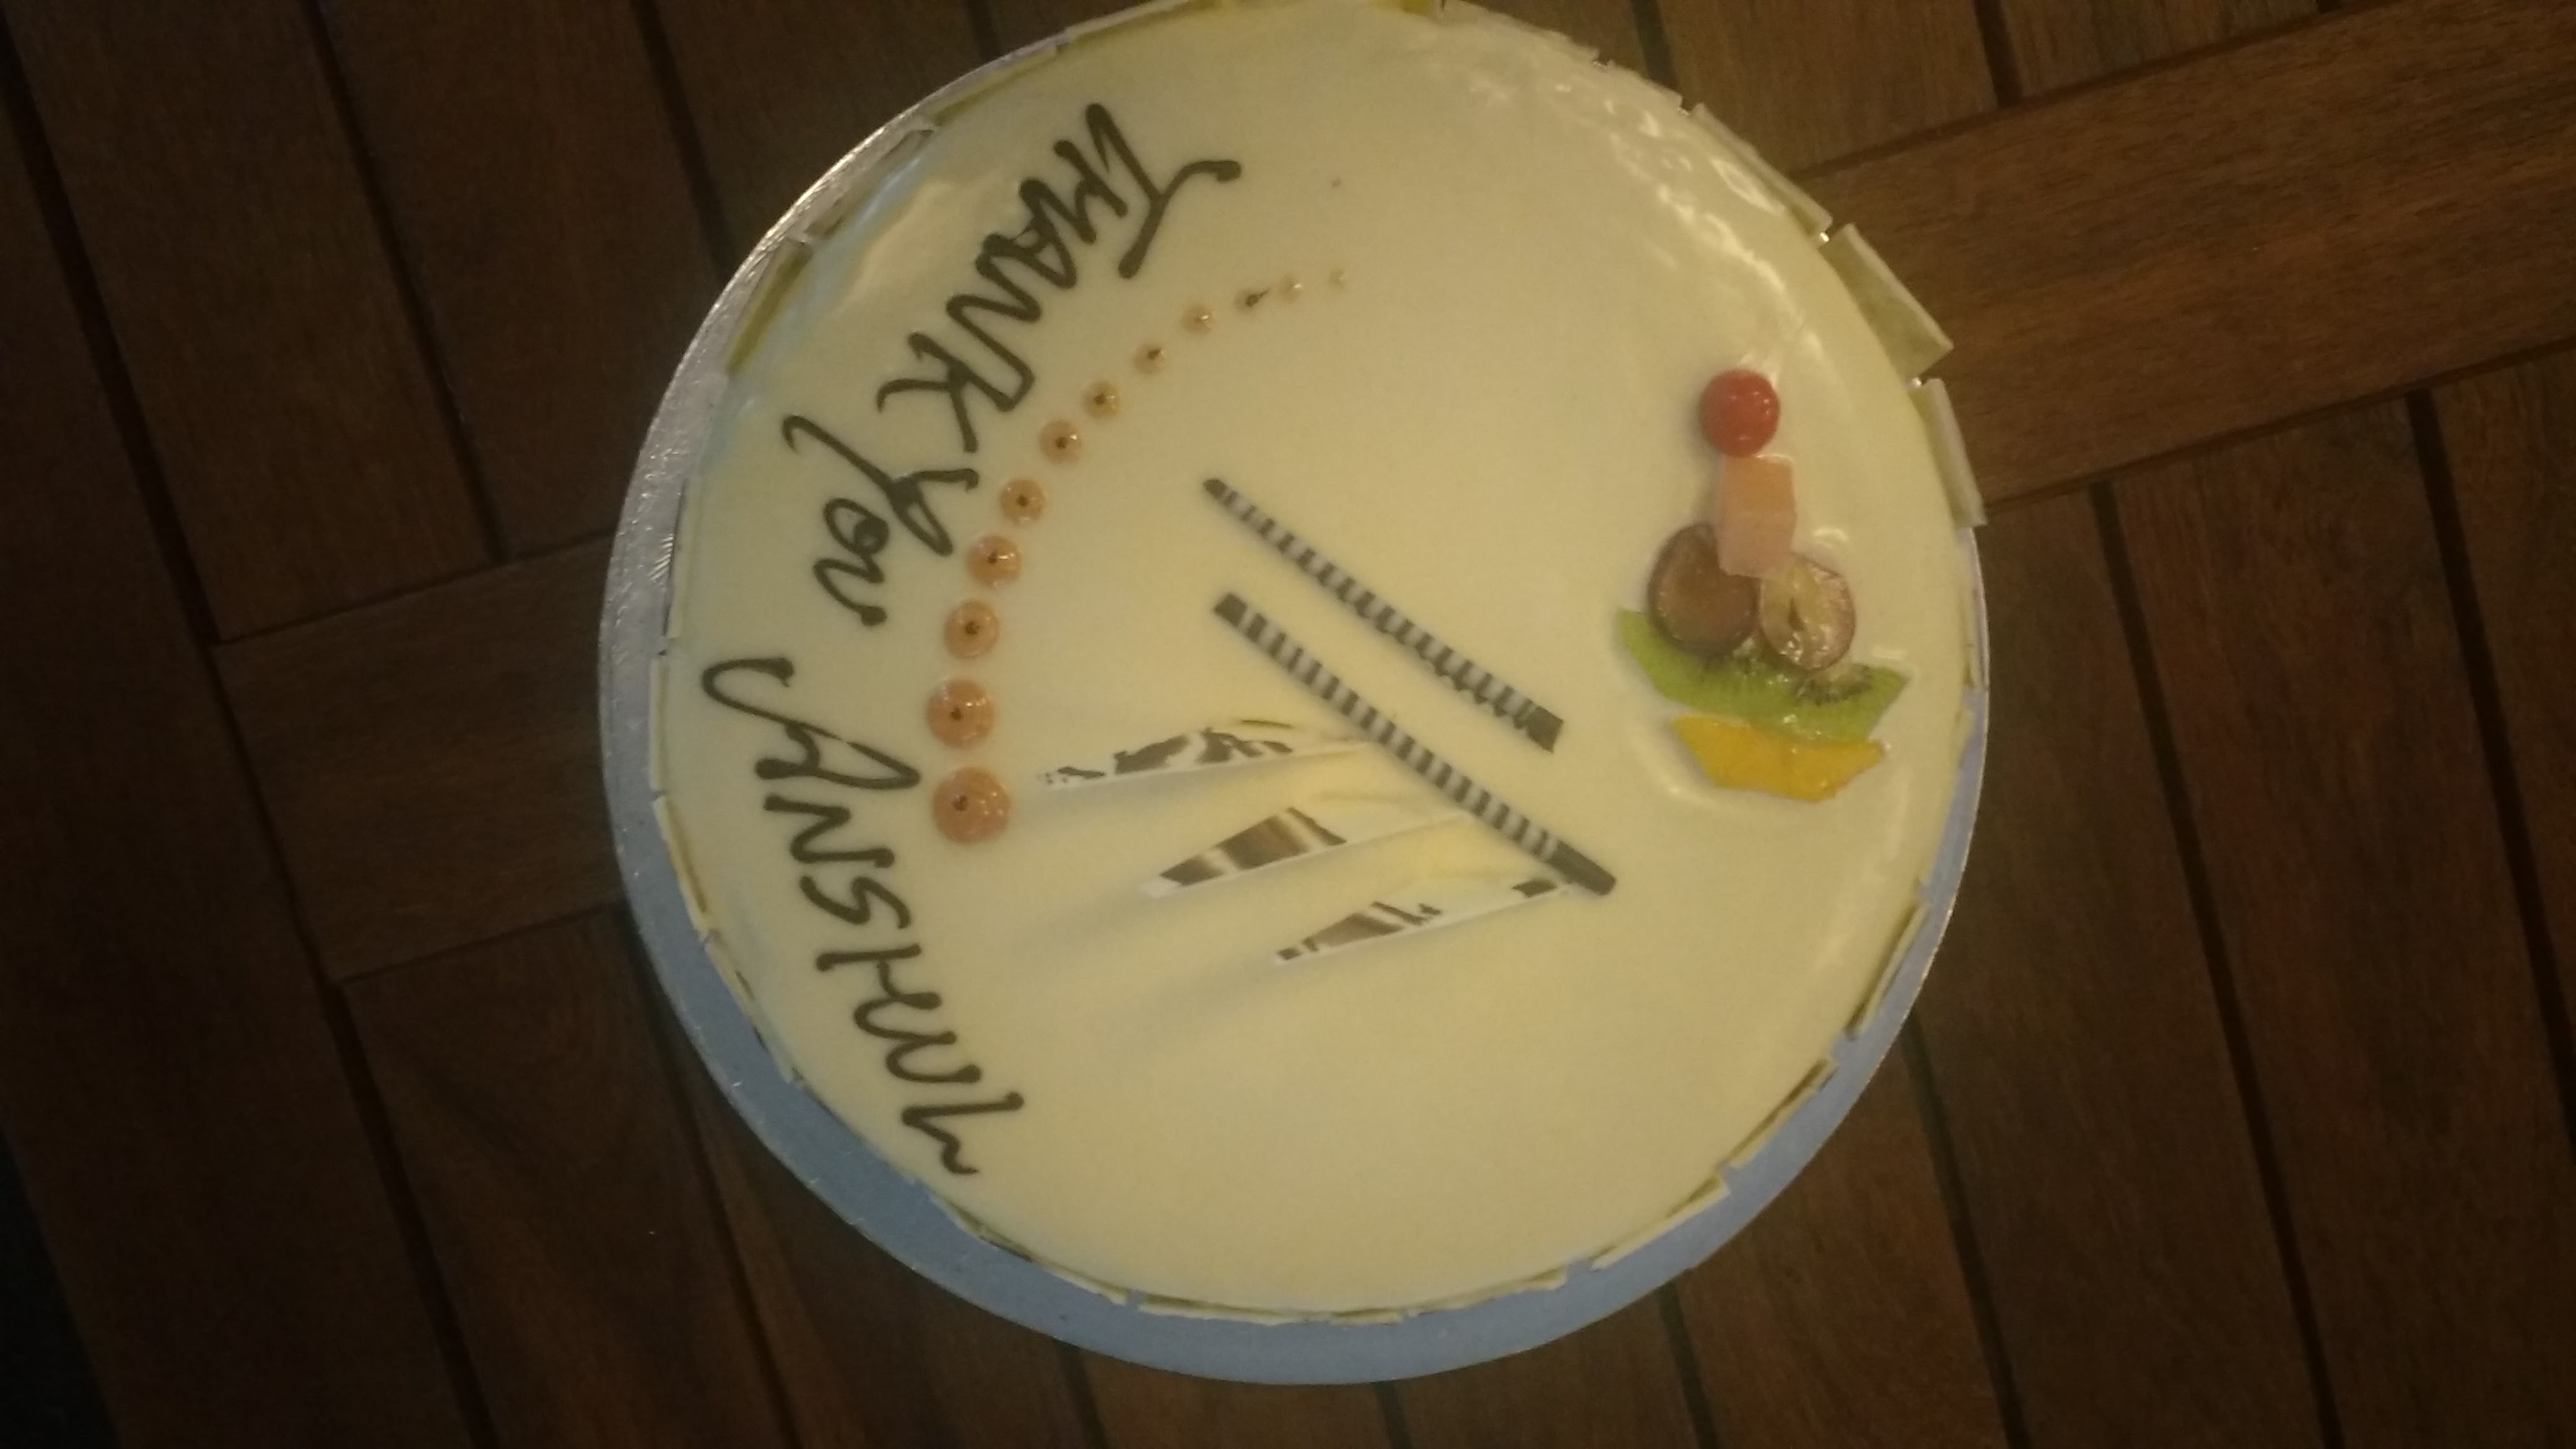 Farewell Cake
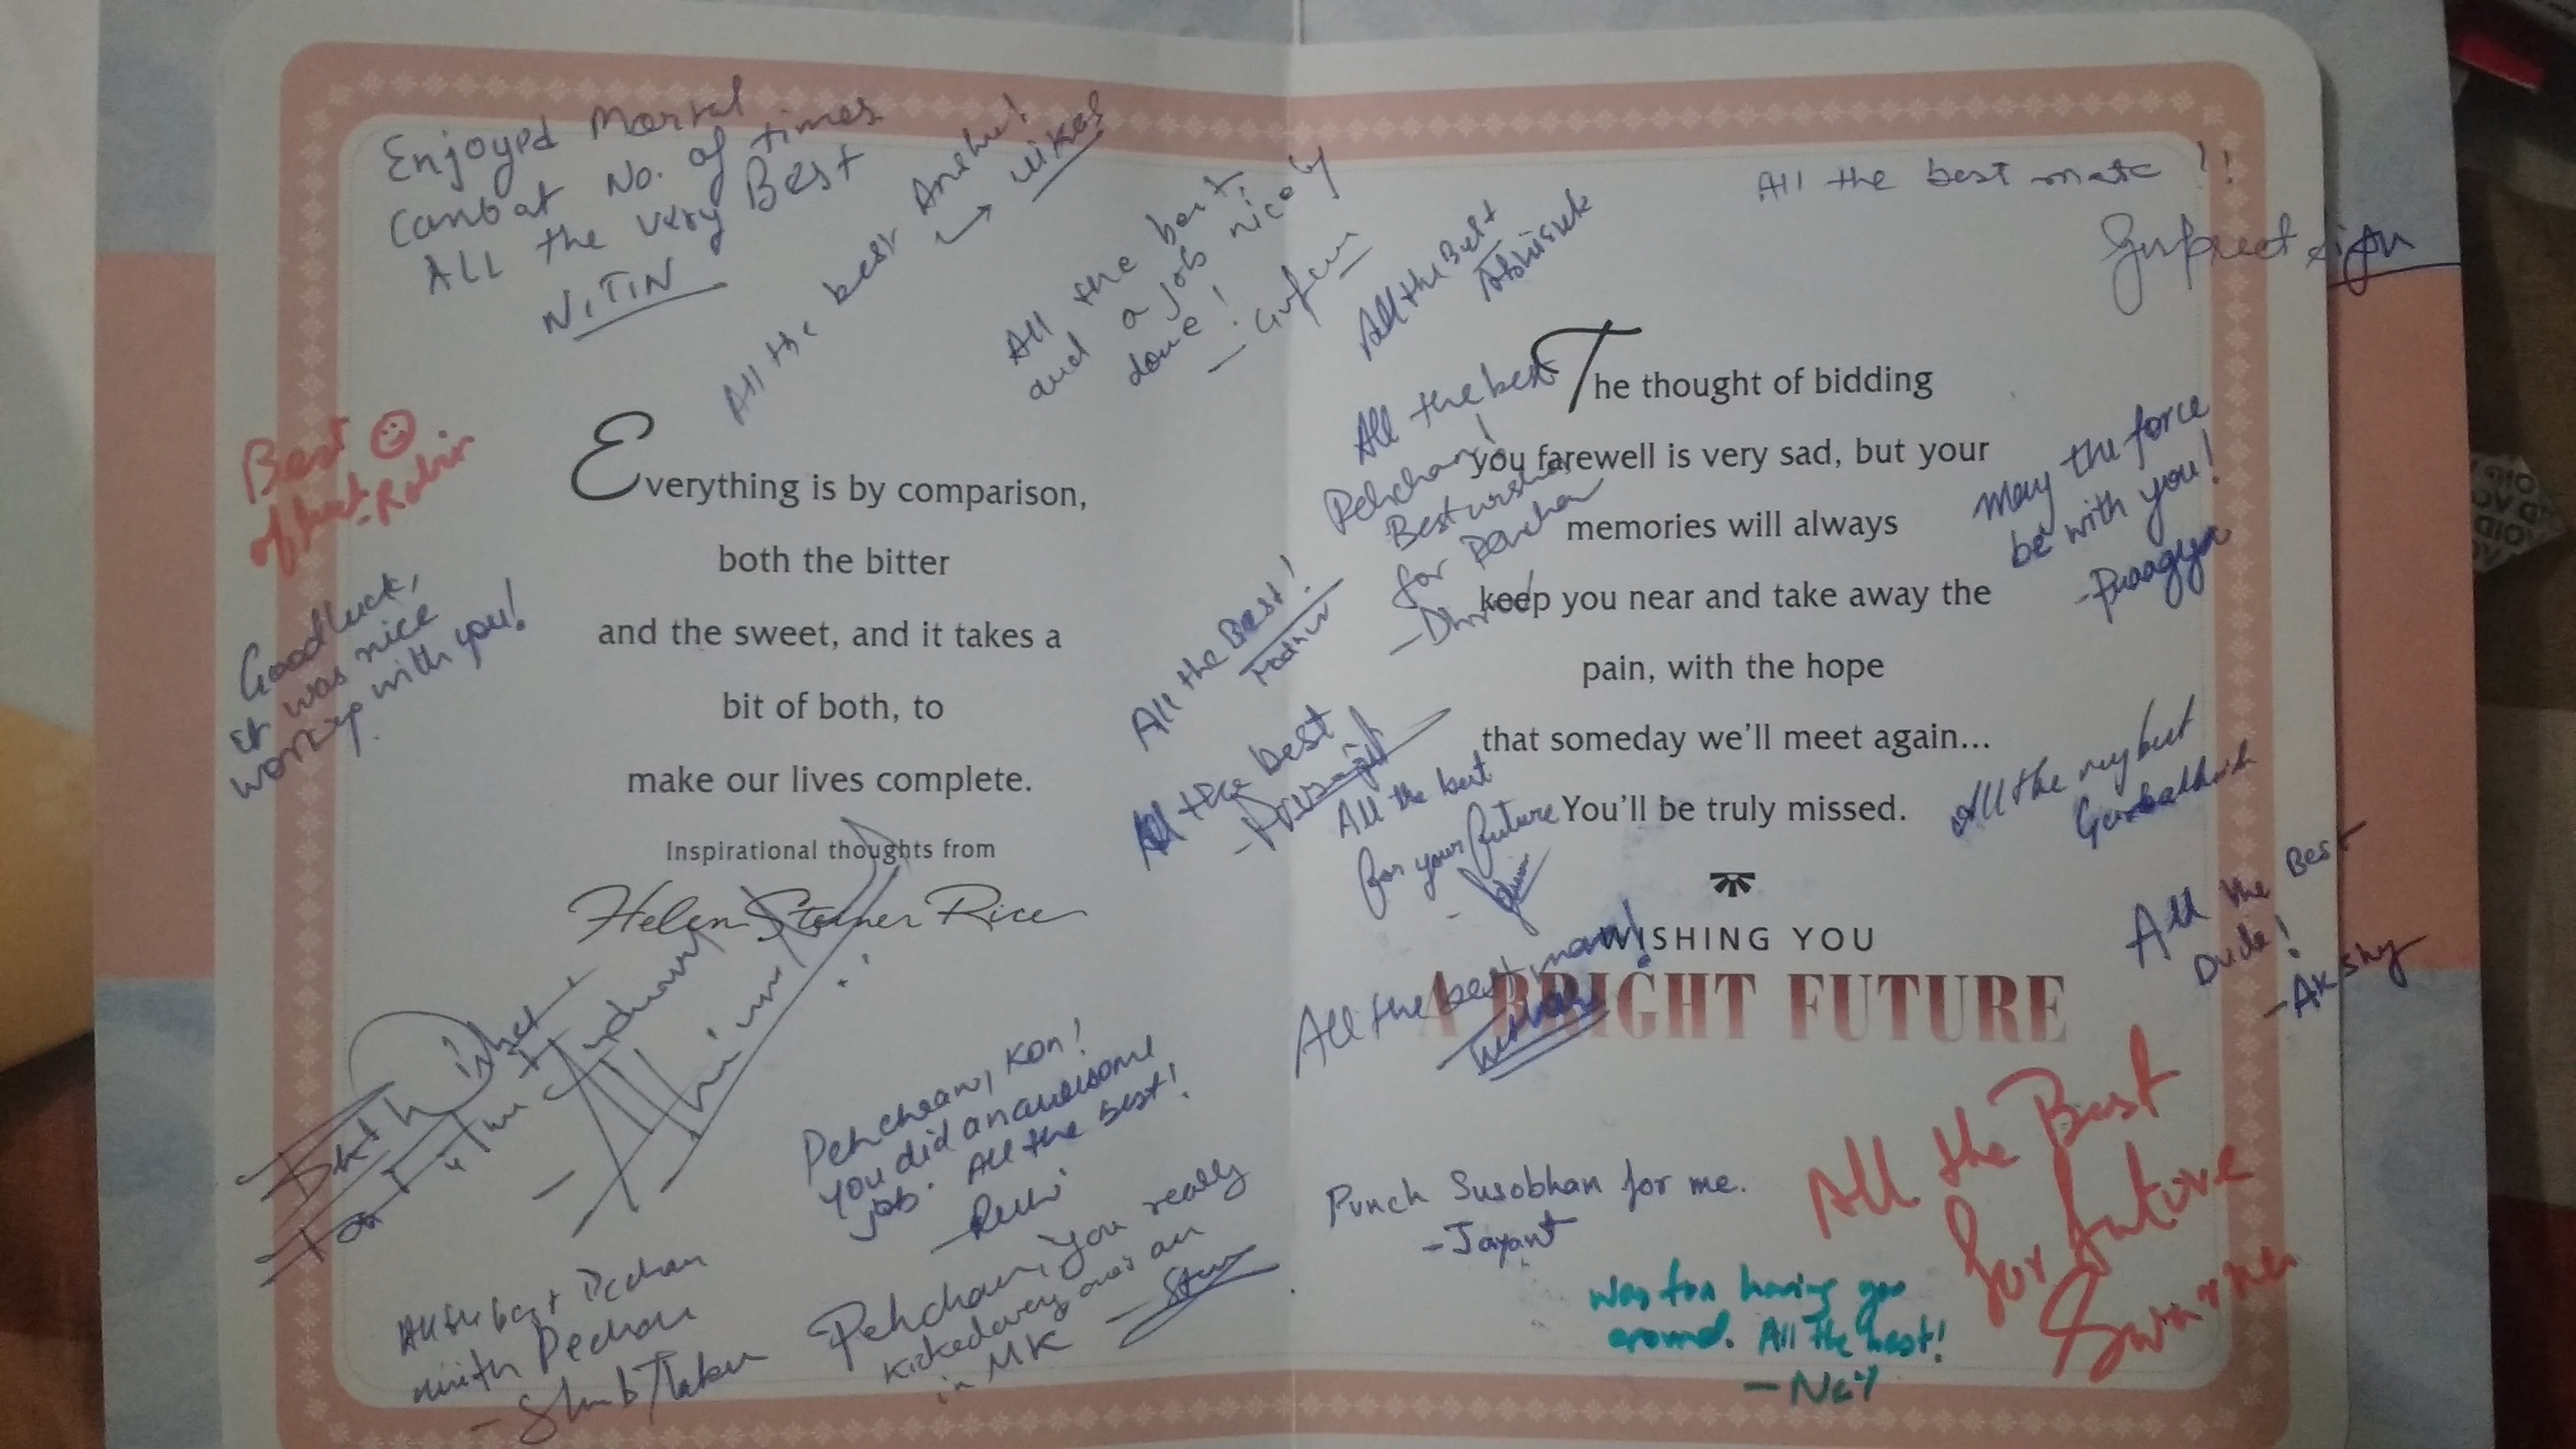 Farewell Card
Life at Kayako
So far I was just talking about work, you must have been bored by now, right? Now if you are reading this blog and you are about to join Kayako, let me tell me you something that may cheer you up. So what’s so cool about Kayako?
The perks
Where do we begin? From an amazing cafeteria with a fridge loaded with all kinds of beverages, and a great arrangement for the meals to unlimited paid leaves, to my favourite pastime, playing Mortal combat on the PS4. The list goes on and on for the incredible perks that Kayako offers its employees.
Freedom
Kayako offers complete freedom to its employees including unlimited paid leaves, flexible work timings, unrestricted internet and much more.
The office digs and culture
I would describe the work setting and culture as, “a fantastic work environment, and a culture that allows you to be yourself.”
If you like fast-paced work environments and opportunities to grow (among all the other awesome perks the company offers) then add Kayako to your list of dream companies to work for.
Conclusion
The interesting part of this project is that it never ends. You will always be adding new matrices, tweaking existing, tuning threshold values for alerting, adding new features for filtering and the list goes on and on.
The most important part of my project was its flexibility and diversity. No extra effort was needed to add more hosts to existing matrices. Chef, Datadog and our implementation took cares of everything. It was the most interesting project which I’ve ever worked on.
No matter what happens next, I want to say thank you to everyone at Kayako who made those two and half months the most exciting part of my life.